Add a stacked horizontal bar plot #274
Description
Problem
Description
This aims to implement a stacked horizontal bar plot function in plot.py, this will better visualize CC0_RECORDS and CC0_RECORDS_WITH_CC0_MEDIA.
We can easily identify the percentage of records without media and with media on same graph.
Example of visuals: stacked bar chart
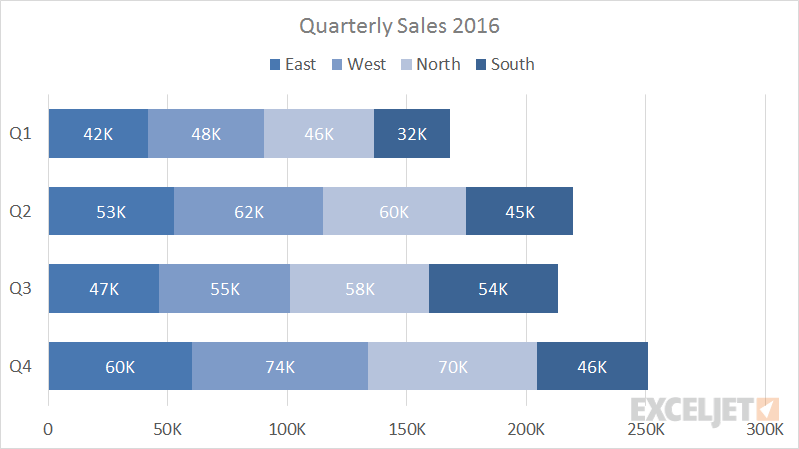
Implementation
- I would be interested in implementing this feature.
Metadata
Metadata
Assignees
Labels
Type
Projects
Status